728x90
반응형
결과화면
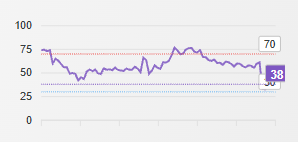
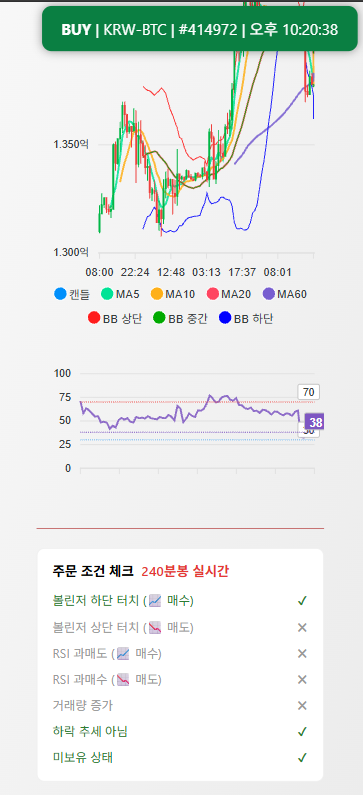
현재 진행하고 있는 코인 자동매매에서 핵심 지표인 RSI 지수를 차트에 추가해주었다.
https://bright-landscape.tistory.com/461
[React] ApexChart로 이동평균선(MA) 그리기
결과화면MA(이동평균)선을 5, 10, 20, 60, 120일 선을 다섯개 추가해주었다. MaCalc.js// period일 이동평균 계산 ( 종가 기준 )export default function MaCalc(data, period) { const result = []; // 여기에 최종 MA 값들이 들
bright-landscape.tistory.com
이전에 ApexChart로 이동평균선(MA)를 그려보았었다. 이번에는 RSI 지수를 그려볼 것이다.
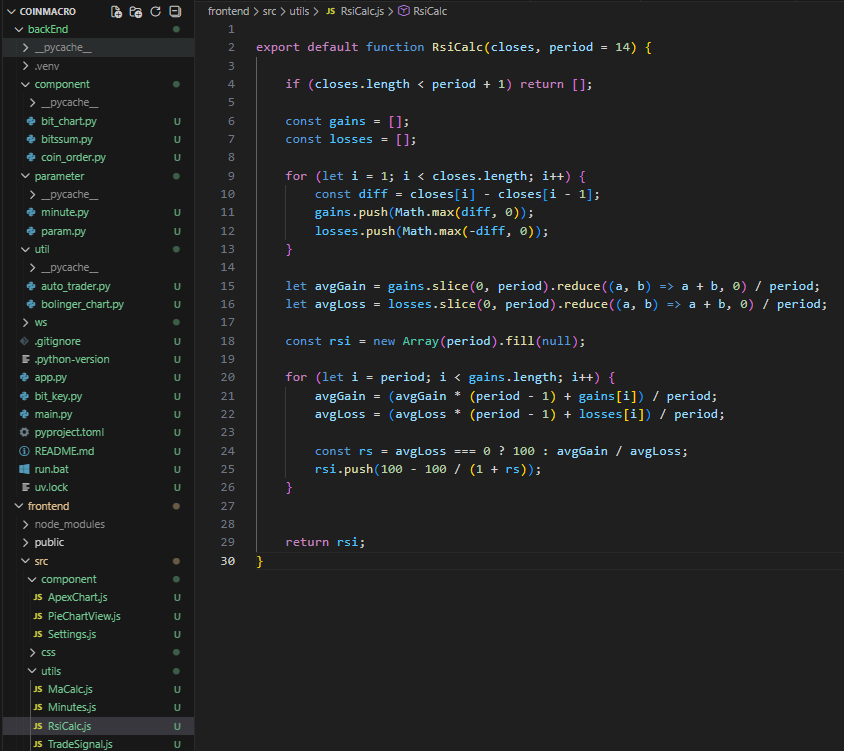
RsiCalc.js
/**
 * RSI(Relative Strength Index) 계산 함수
 * @param {number[]} closes - 캔들 종가 배열
 * @param {number} period - RSI 기간 (기본값 14)
 * @returns {(number|null)[]} RSI 값 배열
 */
export default function RsiCalc(closes, period = 14) {

    // 🔹 RSI 계산을 위해 최소 (period + 1)개의 가격 데이터가 필요
    // 🔹 데이터가 부족하면 계산 불가 → 빈 배열 반환
    if (closes.length < period + 1) return [];

    // 🔹 상승폭(양수)만 저장할 배열
    const gains = [];

    // 🔹 하락폭(음수의 절대값)만 저장할 배열
    const losses = [];

    // 🔹 종가 배열을 순회하며 전 캔들과의 가격 차이 계산
    for (let i = 1; i < closes.length; i++) {

        // 현재 종가 - 이전 종가
        const diff = closes[i] - closes[i - 1];

        // 🔹 상승한 경우 diff 값 그대로 사용, 하락/보합이면 0
        gains.push(Math.max(diff, 0));

        // 🔹 하락한 경우 절대값으로 저장, 상승/보합이면 0
        losses.push(Math.max(-diff, 0));
    }

    // 🔹 최초 평균 상승폭(SMA 방식)
    // 🔹 RSI 첫 계산은 단순 이동평균으로 시작
    let avgGain =
        gains.slice(0, period).reduce((a, b) => a + b, 0) / period;

    // 🔹 최초 평균 하락폭(SMA 방식)
    let avgLoss =
        losses.slice(0, period).reduce((a, b) => a + b, 0) / period;

    // 🔹 RSI 결과 배열
    // 🔹 앞의 period 구간은 RSI가 존재하지 않으므로 null로 채움
    const rsi = new Array(period).fill(null);

    // 🔹 period 이후부터 RSI 계산 시작
    for (let i = period; i < gains.length; i++) {

        // 🔹 Wilder 방식 EMA 평균 갱신 공식
        // 🔹 이전 평균에 가중치를 주어 노이즈 감소
        avgGain = (avgGain * (period - 1) + gains[i]) / period;
        avgLoss = (avgLoss * (period - 1) + losses[i]) / period;

        // 🔹 RS(Relative Strength) 계산
        // 🔹 평균 하락이 0이면 RSI는 100으로 처리
        const rs = avgLoss === 0 ? 100 : avgGain / avgLoss;

        // 🔹 RSI 공식 적용
        // 🔹 RSI = 100 - (100 / (1 + RS))
        const rsiValue = 100 - 100 / (1 + rs);

        // 🔹 RSI 값 배열에 추가
        rsi.push(rsiValue);
    }

    // 🔹 계산된 RSI 배열 반환
    // 🔹 (앞부분은 null, 이후부터 실제 RSI 값)
    return rsi;
}
ApexChart.js
import { useEffect, useState, useRef } from "react";
import axios from "axios";
import Chart from "react-apexcharts";
import MaCalc from "../utils/MaCalc";
import RsiCalc from "../utils/RsiCalc";

import { useTradeConfig } from "../utils/Minutes";

import { useTradeSignal } from "../utils/TradeSignal";


const MAX_CANDLES = 100;

function ApexChart() {
    const [candles, setCandles] = useState([]);
    const wsRef = useRef(null);
    const minute = useTradeConfig((s) => s.minute); //
    console.log("선택된 minute:", minute);

    const action = useTradeSignal((s) => s.action);
    console.log("액션은 ?", action)

    /* =========================
     * 1️⃣ 초기 캔들 로딩 (REST API)
     * ========================= */
    const loadInitialCandles = async () => {
        try {
            const res = await axios.get(`http://localhost:8000/chart?minute=${minute}`);

            const sorted = res.data.sort(
                (a, b) =>
                    new Date(a.candle_date_time_kst) - new Date(b.candle_date_time_kst)
            );

            const formatted = sorted.map(item => ({
                timestamp: new Date(item.candle_date_time_kst).getTime(),
                open: item.opening_price,
                high: item.high_price,
                low: item.low_price,
                close: item.trade_price,
            }));

            setCandles(formatted.slice(-MAX_CANDLES));
        } catch (err) {
            console.error("초기 캔들 로딩 실패", err);
        }
    };


    /* =========================
     * 2️⃣ WebSocket 실시간 업데이트
     * ========================= */
    const connectWs = () => {
        const ws = new WebSocket(`ws://localhost:8000/ws/charts?minute=${minute}`);
        wsRef.current = ws;

        ws.onopen = () => console.log("WS 연결됨");

        ws.onmessage = (event) => {
            try {
                const t = JSON.parse(event.data);
                const price = t.trade_price;
                const ts = t.trade_timestamp;
                console.log("price ->", price)

                setCandles(prev => {
                    if (prev.length === 0) return prev;

                    const list = [...prev];
                    const last = { ...list[list.length - 1] };

                    const lastMin = Math.floor(last.timestamp / 60000);
                    const nowMin = Math.floor(ts / 60000);

                    /* 새 분 시작 → 새 캔들 */
                    if (nowMin !== lastMin) {
                        if (list.length >= MAX_CANDLES) list.shift(); // 이전 캔들 삭제
                        list.push({
                            timestamp: ts,
                            open: price,
                            high: price,
                            low: price,
                            close: price,
                        });
                        return list;
                    }

                    /* 같은 분 → 기존 캔들 업데이트 */
                    last.high = Math.max(last.high, price);
                    last.low = Math.min(last.low, price);
                    last.close = price;

                    list[list.length - 1] = last;
                    return list;
                });

            } catch (err) {
                console.error("WS JSON 파싱 오류:", err);
            }
        };

        ws.onclose = () => {
            console.log("WS 종료 → 재연결");
            setTimeout(connectWs, 2000);
        };
    };

    /* =========================
     * 3️⃣ 컴포넌트 최초 실행
     * ========================= */
    useEffect(() => {
        loadInitialCandles();
        connectWs();
        return () => {
            if (wsRef.current) wsRef.current.close();
        };
    }, []);

    if (candles.length === 0) return <div>Loading...</div>;

    /* =========================
     * 4️⃣ 시리즈용 데이터 변환
     * ========================= */
    const seriesData = candles.map(c => ({
        x: new Date(c.timestamp),
        y: [c.open, c.high, c.low, c.close],
    }));

    /* =========================
    * RSI 계산
    * ========================= */
    const rsiPeriod = 14;

    const rsiValues = RsiCalc(
        candles.map(c => c.close),
        rsiPeriod
    );

    // RSI 값
    const rsiSeriesData = rsiValues
        .map((v, i) =>
            v == null ? null : { x: seriesData[i].x, y: v }
        )
        .filter(Boolean);

    // 최신 RSI 값 구하기.
    const latestRsi = rsiSeriesData.length
        ? Math.round(rsiSeriesData[rsiSeriesData.length - 1].y)
        : null;

    /* =========================
     * 5️⃣ 이동평균
     * ========================= */
    const makeMa = (n) =>
        MaCalc(candles.map(c => ({ trade_price: c.close })), n)
            .map((v, i) =>
                v == null ? null : { x: seriesData[i].x, y: v }
            )
            .filter(Boolean);

    /* =========================
     * 6️⃣ 볼린저밴드 계산
     * ========================= */
    const makeBollinger = (n = 20, k = 2) => {
        if (candles.length < n) return { upper: [], lower: [], middle: [] };

        const closes = candles.map(c => c.close);
        const middle = MaCalc(candles.map(c => ({ trade_price: c.close })), n);

        const upper = [];
        const lower = [];
        const middleSeries = [];

        for (let i = 0; i < closes.length; i++) {
            const x = seriesData[i].x;
            if (i < n - 1 || middle[i] == null) {
                continue; // 아직 볼린저 계산 불가 → skip
            }

            const window = closes.slice(i - n + 1, i + 1);
            const mean = middle[i];
            const std = Math.sqrt(window.reduce((acc, v) => acc + (v - mean) ** 2, 0) / n);

            upper.push({ x, y: mean + k * std });
            lower.push({ x, y: mean - k * std });
            middleSeries.push({ x, y: mean });
        }

        return { upper, lower, middle: middleSeries };
    };

    const { upper: bbUpper, lower: bbLower, middle: bbMiddle } = makeBollinger(20, 2);

    /* =========================
 * 7️⃣ 차트 시리즈
 * ========================= */

    // 1. 캔들
    const candleSeries = [
        {
            name: "캔들",
            type: "candlestick",
            data: seriesData,
        },
    ];

    // 2. 이동평균선
    const maSeries = [
        { name: "MA5", type: "line", data: makeMa(5) },
        { name: "MA10", type: "line", data: makeMa(10) },
        { name: "MA20", type: "line", data: makeMa(20) },
        { name: "MA60", type: "line", data: makeMa(60) },
    ];

    // 3. 볼린저 밴드
    const bollingerSeries = [
        { name: "BB 상단", type: "line", data: bbUpper, color: "#ff1c1c" },
        { name: "BB 중간", type: "line", data: bbMiddle, color: "#00aa00" },
        { name: "BB 하단", type: "line", data: bbLower, color: "#0000ff" },
    ];

    // 4. 최종 시리즈
    const series = [
        ...candleSeries,
        ...maSeries,
        ...bollingerSeries,
    ];

    /* =========================
     * 8️⃣ 차트 옵션
     * ========================= */
    const options = {
        chart: {
            type: "line",
            height: 450,
            animations: { enabled: false },
        },
        xaxis: {
            type: "datetime",
            tickAmount: 6,
            labels: {
                formatter: (value) => {
                    const date = new Date(value);
                    return date.toLocaleTimeString("ko-KR", {
                        hour: "2-digit",
                        minute: "2-digit",
                        hour12: false,
                        timeZone: "Asia/Seoul",
                    });
                },
            },
        },
        yaxis: {
            labels: {
                formatter: (value) => value == null ? "" : (value / 100000000).toFixed(3) + "억",
            },
        },
        stroke: { width: [1, 2, 2, 2, 2, 1, 1, 1] },
        tooltip: {
            shared: true,
            y: {
                formatter: (value) => value == null ? "" : (value / 100000000).toFixed(2) + "억",
            },
        },
    };


    // 🔹 임시 조건 결과 (나중에 실제 계산으로 교체)
    const conditionState = {
        bbLowerTouch: action === "BUY",
        bbUpperTouch: action === "SELL",
        rsiOversold: false,
        rsiOversbuy: false,
        volumeIncrease: false,
        trendNotDown: true,
        noPosition: true,
    };

    const buyConditions = [
        { key: "bbLowerTouch", label: "볼린저 하단 터치 (📈 매수)", passed: conditionState.bbLowerTouch },
        { key: "bbUpperTouch", label: "볼린저 상단 터치 (📉 매도)", passed: conditionState.bbUpperTouch },
        { key: "rsiOversold", label: "RSI 과매도 (📈 매수)", passed: conditionState.rsiOversold },
        { key: "rsiOverbuy", label: "RSI 과매수 (📉 매도)", passed: conditionState.rsiOverbuy },
        { key: "volumeIncrease", label: "거래량 증가", passed: conditionState.volumeIncrease },
        { key: "trendNotDown", label: "하락 추세 아님", passed: conditionState.trendNotDown },
        { key: "noPosition", label: "미보유 상태", passed: conditionState.noPosition },
    ];

    // RSI 전용 차트
    const rsiOptions = {
        chart: {
            type: "line",
            height: 160,
            animations: { enabled: false },
            toolbar: { show: false },
        },
        xaxis: {
            type: "datetime",
            tickAmount: 6,
            labels: {
                formatter: () => "",
            },
        },
        yaxis: {
            min: 0,
            max: 100,
            tickAmount: 4,
            labels: {
                formatter: (value) => Math.round(value), // 소수점 제거
            },
        },
        stroke: { width: 2 },
        colors: ["#7e57c2"],
        annotations: {
            yaxis: [
                { y: 70, borderColor: "#ef5350", label: { text: "70" } },
                { y: 30, borderColor: "#42a5f5", label: { text: "30" } },

                // 🔥 RSI 마지막 값 우측 고정
                ...(latestRsi != null
                    ? [{
                        y: latestRsi,
                        borderColor: "#7e57c2",
                        label: {
                            text: `${latestRsi}`,
                            position: "right",
                            offsetX: 8,
                            style: {
                                background: "#7e57c2",
                                color: "#fff",
                                fontSize: "12px",
                                fontWeight: 600,
                            },
                        },
                    }]
                    : []),
            ],
        },
        tooltip: {
            x: {
                formatter: (value) => {
                    const date = new Date(value);
                    return date.toLocaleString("ko-KR", {
                        hour: "2-digit",
                        minute: "2-digit",
                        second: "2-digit",
                        hour12: false,
                        timeZone: "Asia/Seoul",
                    });
                },
            },
            y: {
                formatter: (v) => v?.toFixed(2),
            },
        },
    };


    return (
        <div>
            <Chart
                options={options}
                series={series}
                height={450}
            />

            <Chart
                options={rsiOptions}
                series={[
                    {
                        name: `RSI(${rsiPeriod})`,
                        data: rsiSeriesData,
                    },
                ]}
                height={160}
            />

            <div style={{ margin: "16px 0", borderTop: "1px solid #ba4b4bff" }} />
            <div
                style={{
                    marginTop: 20,
                    padding: "12px 16px",
                    border: "1px solid #eee",
                    borderRadius: 8,
                    backgroundColor: "#fff",
                }}
            >
                <div style={{
                    display: "flex",
                    alignItems: "center",
                    gap: 8,
                    fontSize: 14,
                    fontWeight: "bold",
                    marginBottom: 8,
                }}
                >
                    <span>주문 조건 체크</span>
                    <span style={{ color: "#e53935", fontWeight: 600 }}>
                        {minute}분봉 실시간
                    </span>
                </div>

                {buyConditions.map(cond => (
                    <div
                        key={cond.key}
                        style={{
                            display: "flex",
                            justifyContent: "space-between",
                            alignItems: "center",
                            padding: "4px 0",
                            fontSize: 13,
                            color: cond.passed ? "#2E7D32" : "#999",
                        }}
                    >
                        <span>{cond.label}</span>
                        <span>{cond.passed ? "✔" : "✖"}</span>
                    </div>
                ))}
            </div>
        </div >
    );
}

export default ApexChart;

- RSI 계산에 사용되는 기간은 보통 14로 사용되므로 rsiPeriod를 14로 지정하였다.
- rsiValues에서는 종가 배열과 RSI 기간을 RsiCalc 함수에 전달하여 각 캔들의 RSI 값을 계산하였다.
- rsiSeriesData에서는 계산된 RSI 값을 ApexChart에서 사용 가능한 { x, y } 형태의 시리즈 데이터로 변환하였다.
- filter(Boolean)을 사용하여 RSI 계산이 불가능한 구간의 null 값을 제거하고, 실제 표시 가능한 RSI 값만 차트에 렌더링하였다.
최종 흐름 요약 ( 캔들 종가 -> RSI 계산 -> Apex차트용 변환 -> null 제거 -> 최신 RSI 값 추출 )
728x90
반응형
'✨ Front-end > 리액트(React)' 카테고리의 다른 글
| [React] Zustand와 FastAPI으로 분봉 상태 공유하기 (1) | 2026.01.18 |
|---|---|
| [React] ApexChart로 이동평균선(MA) 그리기 (0) | 2025.12.10 |
| JSON데이터를 ApexCharts로 데이터 변환하여 캔들 형식 만들기 (0) | 2025.12.09 |
| [Spring-Boot , React] 스프링부트와 React 연동하기 (0) | 2023.09.26 |
| [React] 에러 react-scripts 은(는) 내부 또는 외부 명령 실행할 수 있는 프로그램 또는 배치 파일이 아닙니다. (0) | 2023.09.26 |


댓글